
JMeter and Jenkins - JMeter Basics Part 4 of 4
Continuous Performance Testing - The First Step
JMeter and Jenkins

Where are we?
Installing Jenkins using Docker
Jenkins is installed locally in many ways depending on your OS.
On Mac, you can use brew:
brew install jenkinsOn Debian, you can use apt:
wget -q -O - https://pkg.jenkins.io/debian-stable/jenkins.io.key | sudo apt-key add -

deb https://pkg.jenkins.io/debian-stable binary/

sudo apt update
sudo apt install jenkins
You can find the instructions to other systems here.
In the end, you can simply run bash jenkins and the service will be up and running.
The command will give the initial administrator password. The next screens will guide you through Jenkins configuration. For our purposes you can simply use the default options.
Afterwards Jenkins will be ready to go!
Running JMeter from the command line
To configure Jenkins, we will need to learn how to run our Jenkins plans from the command line.
The first step is to identify the location of your JMeter.
On Linux and Windows, it will probably the folder that you extracted JMeter. On Mac, if you installed JMeter using brew, you can use where jmeter to find out (it will probably be /usr/local/bin/jmeter).
Then, to run JMeter in a NON_GUI fashion, you can run the following command:
PATH_TO_JMETER/bin/jmeter -n -t PATH_TO_MY_PLAN/MY_PLAN.jmx -l PATH_WHERE_I_WANT_TO_SAVE_THE_RESULTS/MY_PLAN.jtlThe only new part is the cryptic .jtl file. This is a XML or CSV format used by JMeter to save its results. After you run the command, you shall see a new or updated file in the indicated folder.
Creating a Jenkins job to execute the JMeter plan
For this example, we will be using a JMeter plan that makes call to the Open Maps API.
For starters, we will add the Performance plugin, in order to have nice reports on JMeter screen.
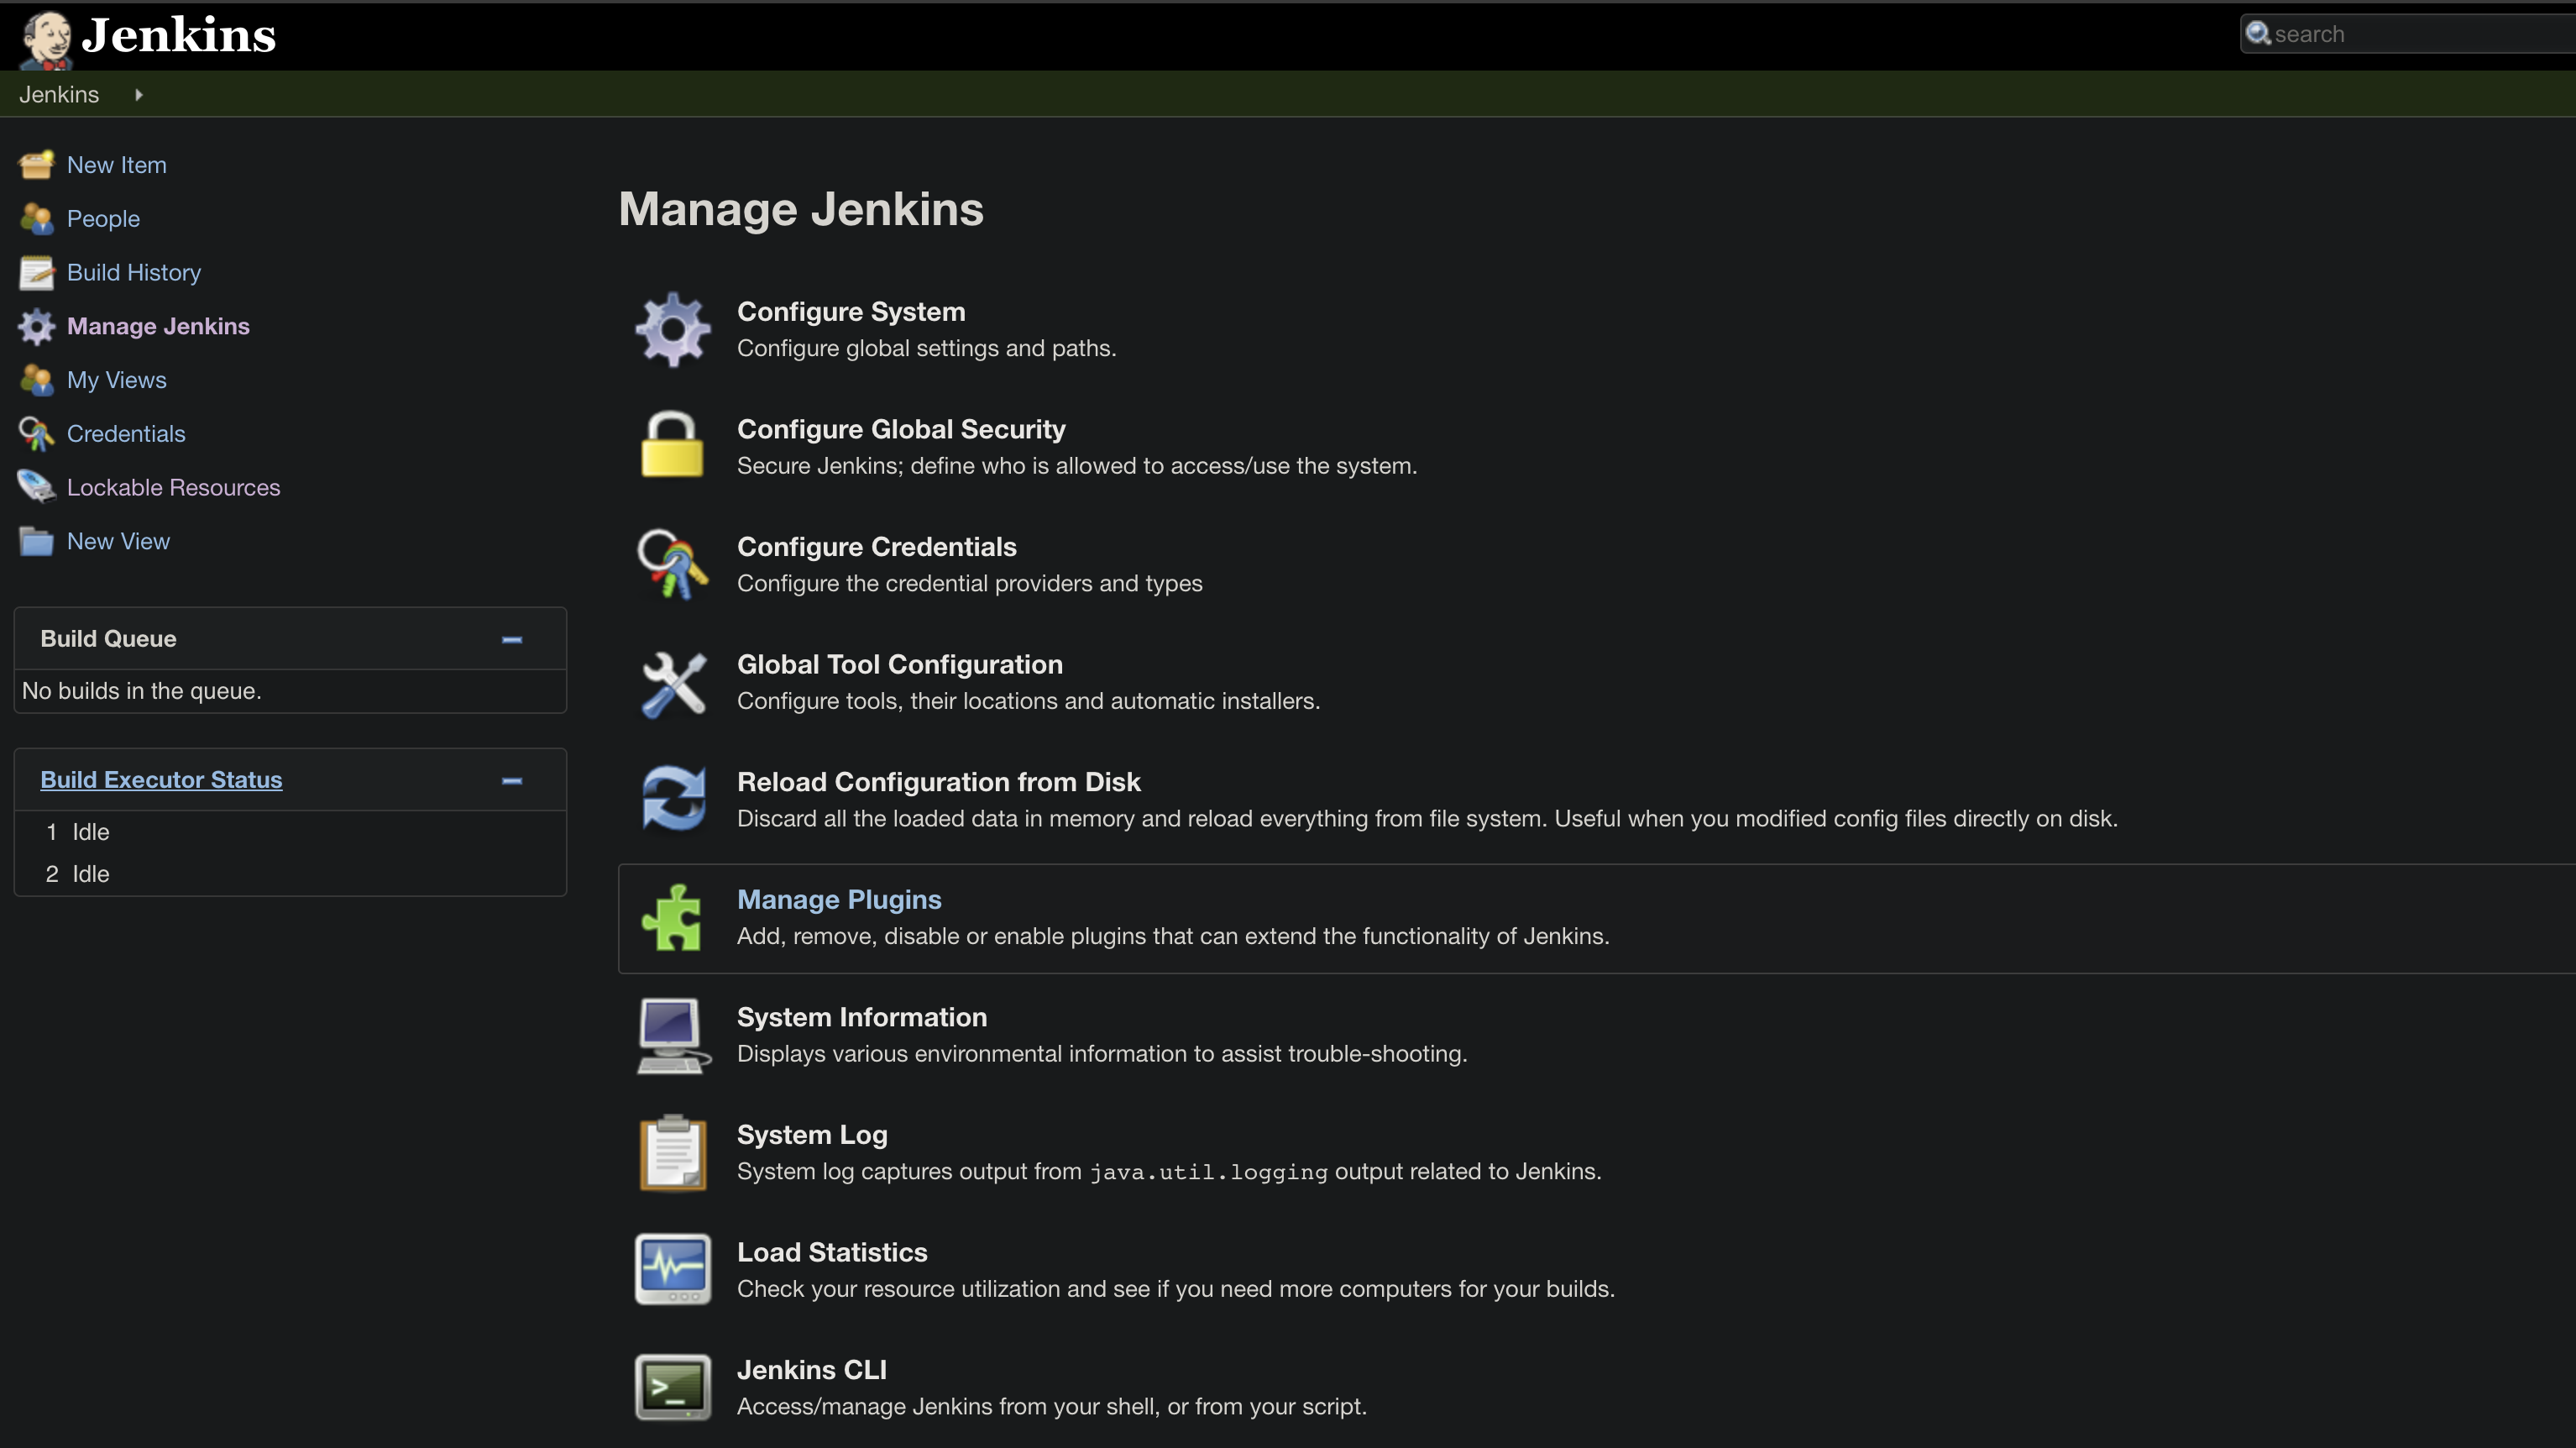
To add it, go to Manage Jenkins and Manage Plugins.
Then Select Performance form the Available tab.
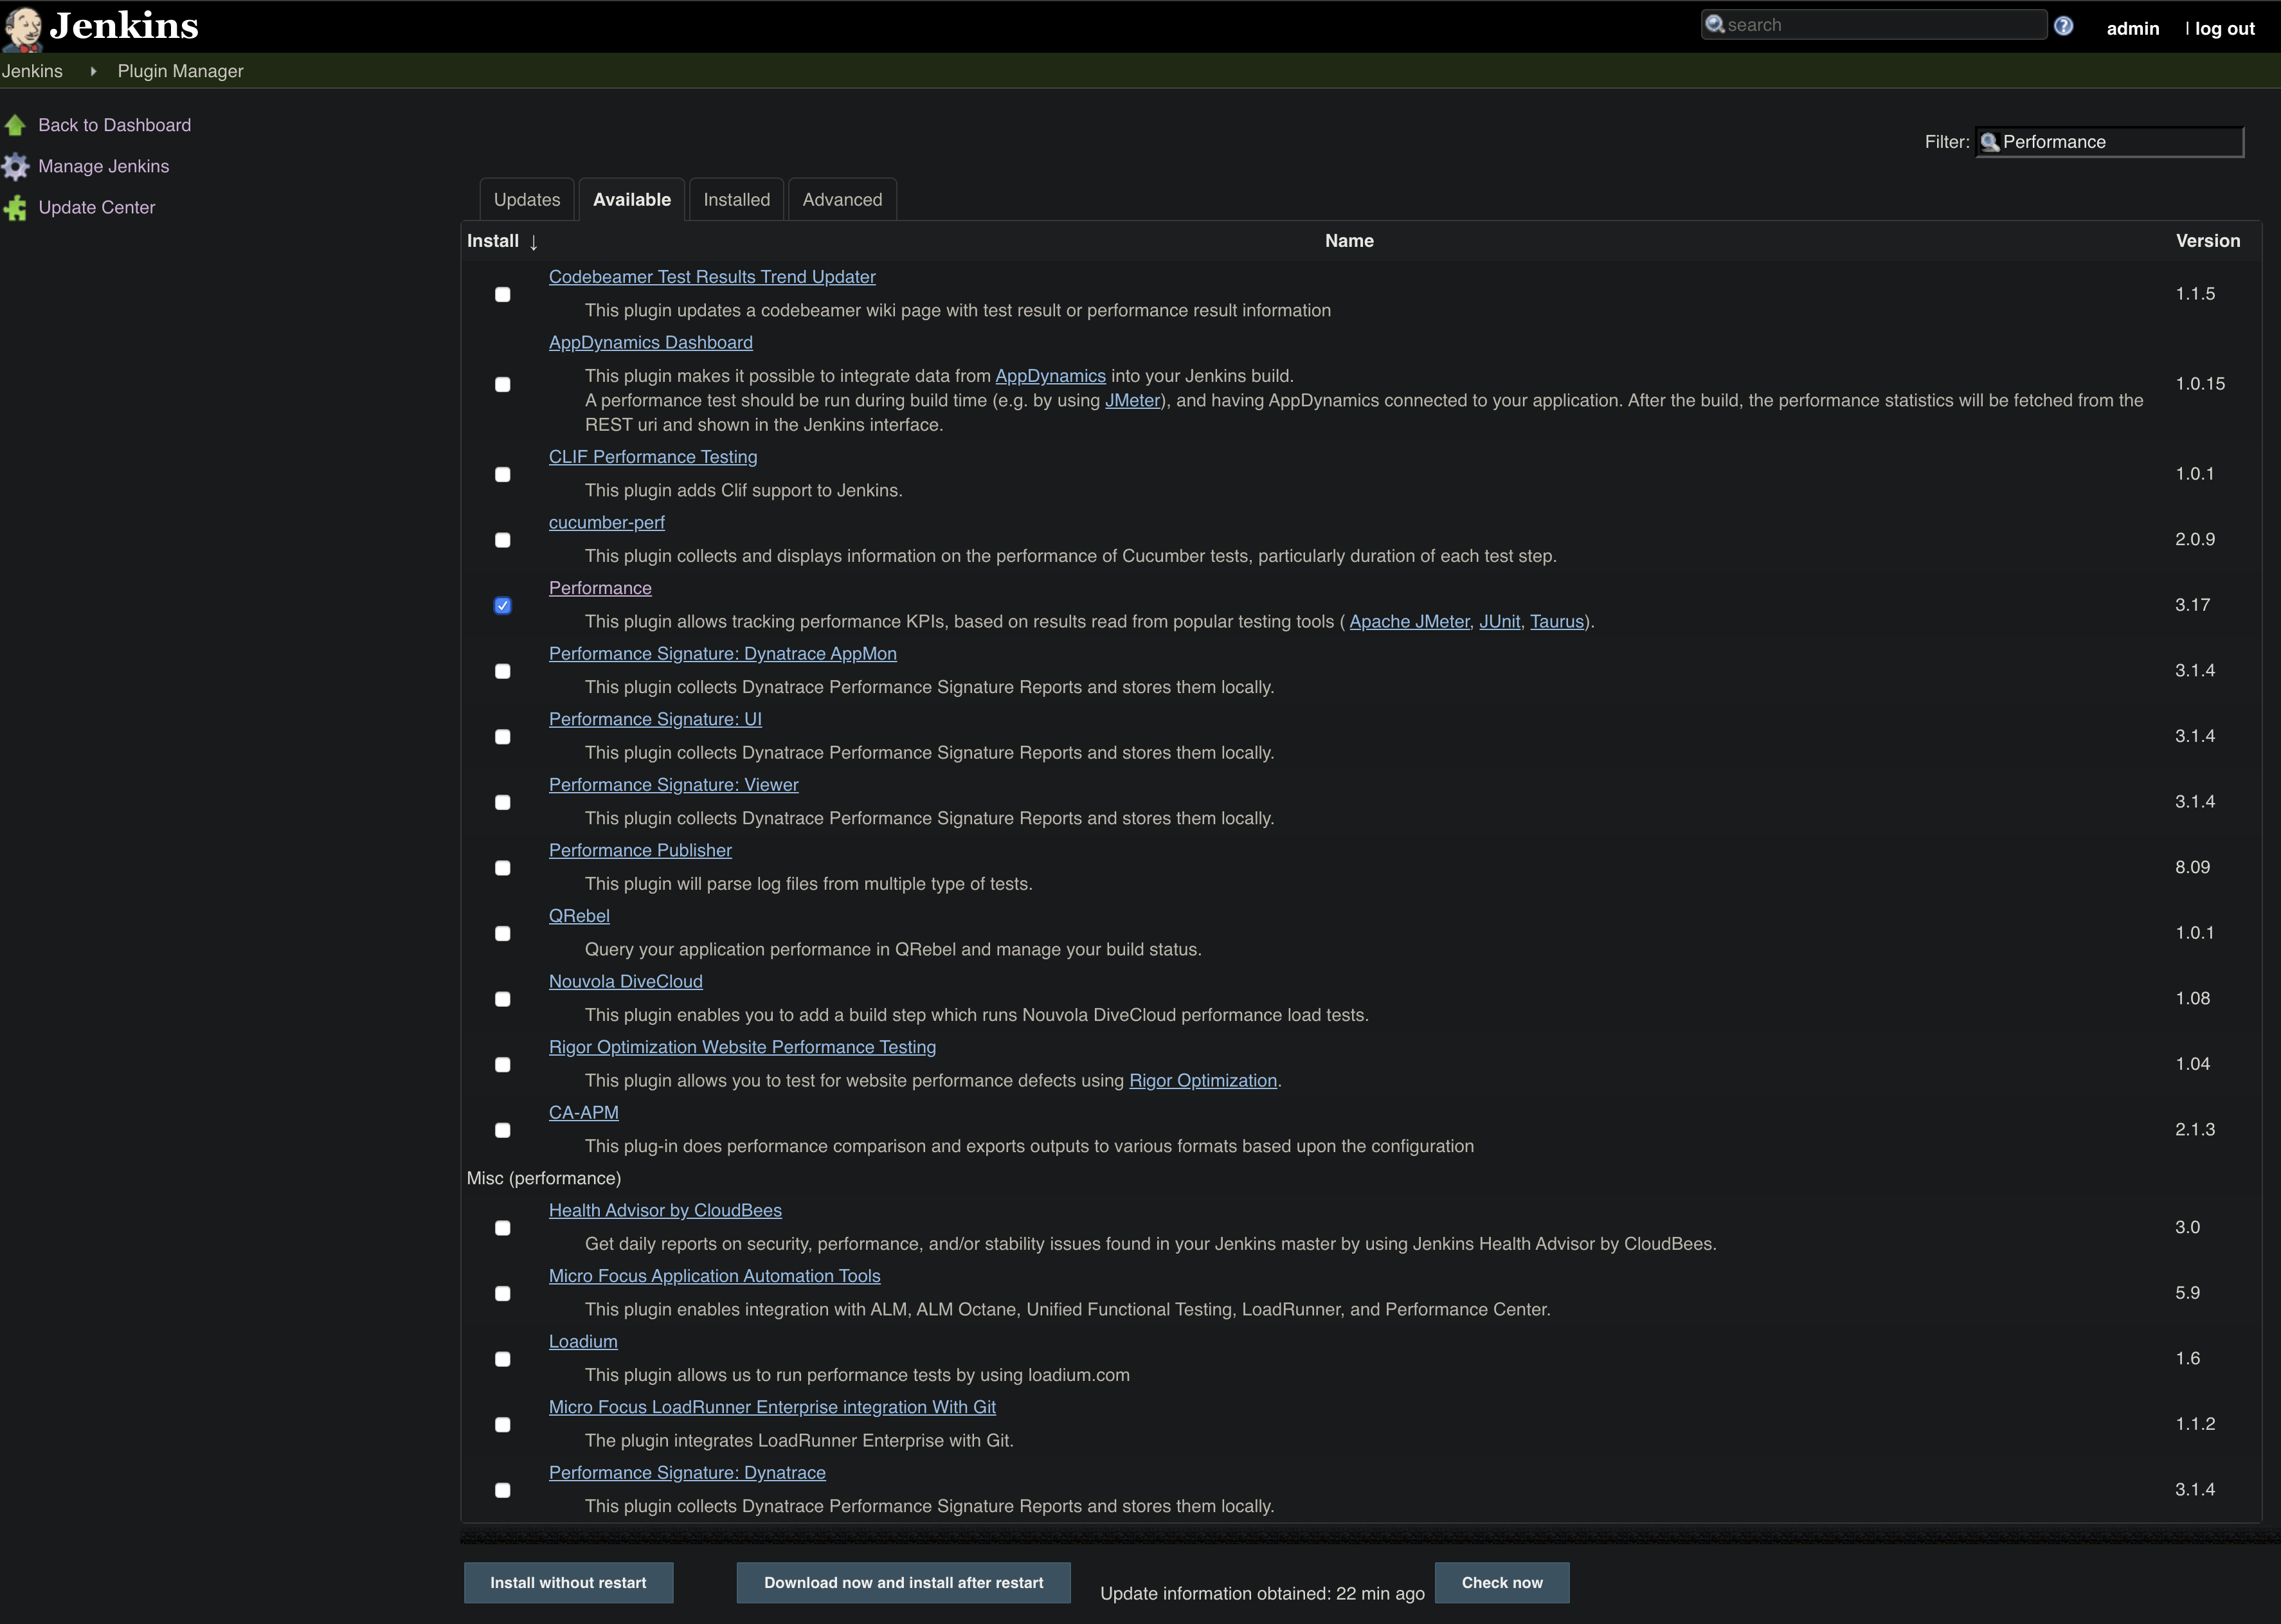
No restart is necessary.
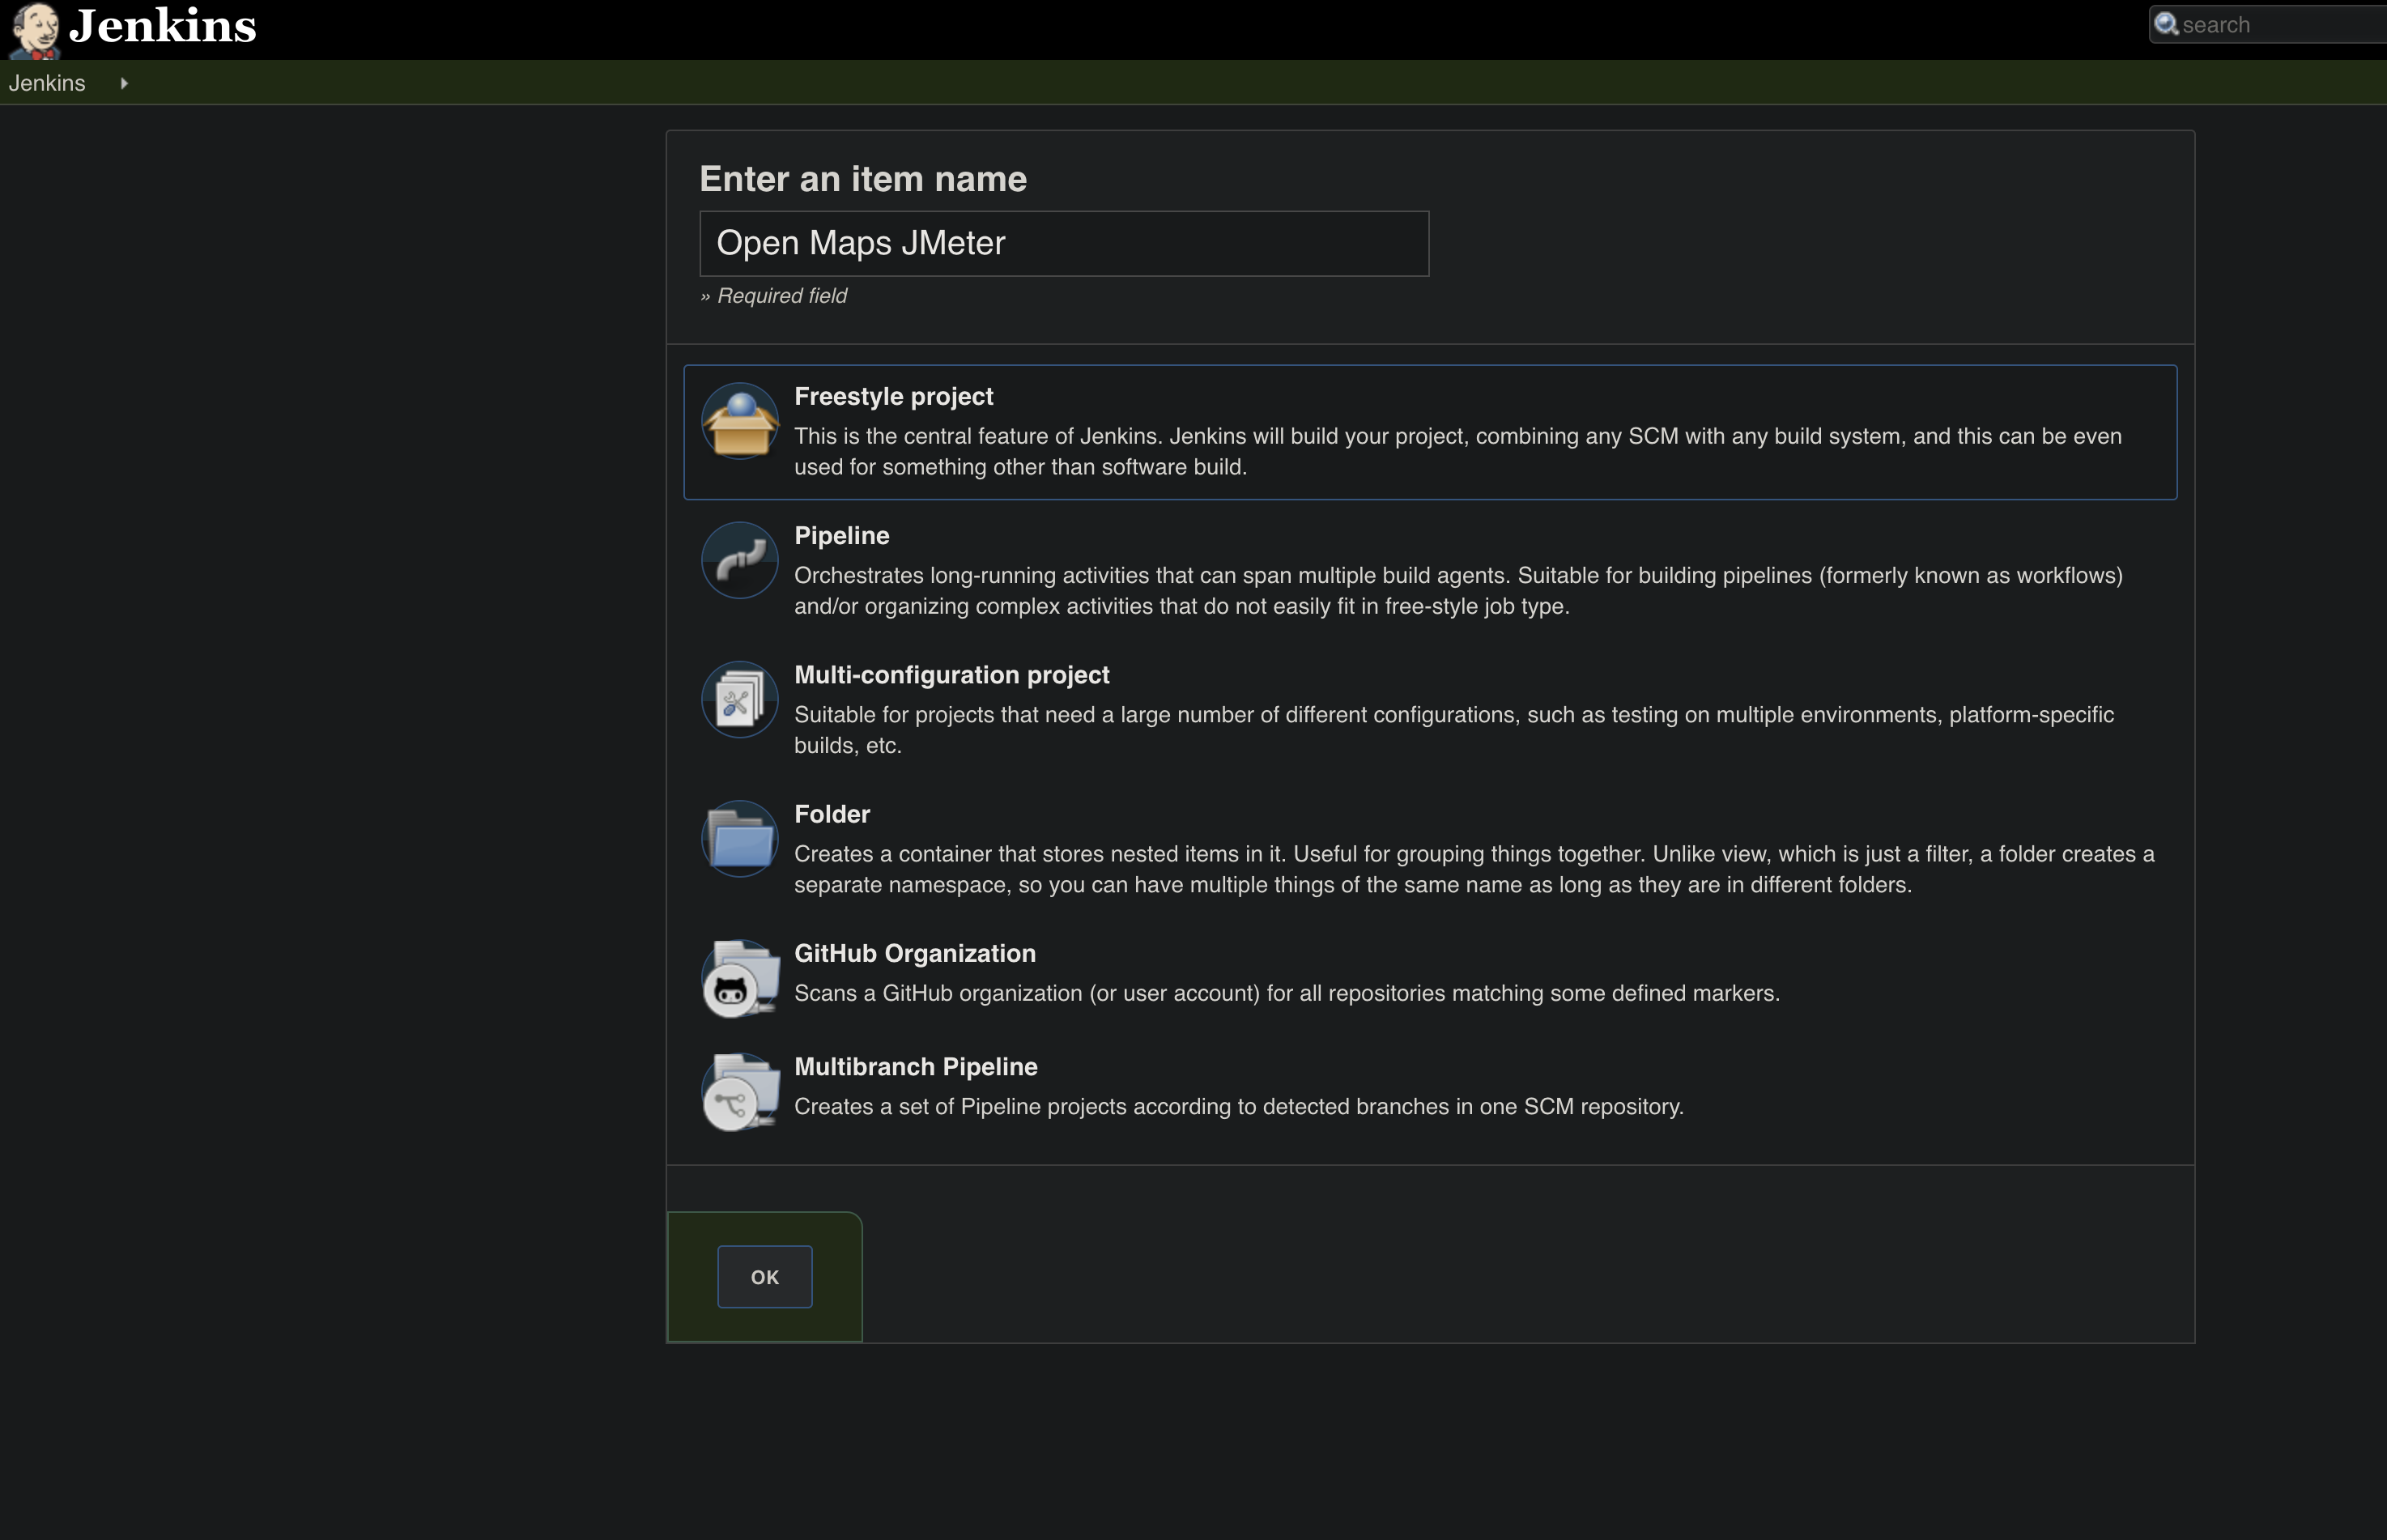
Back on Jenkins initial screen, you can click on create new jobs and then create a Freestyle project.
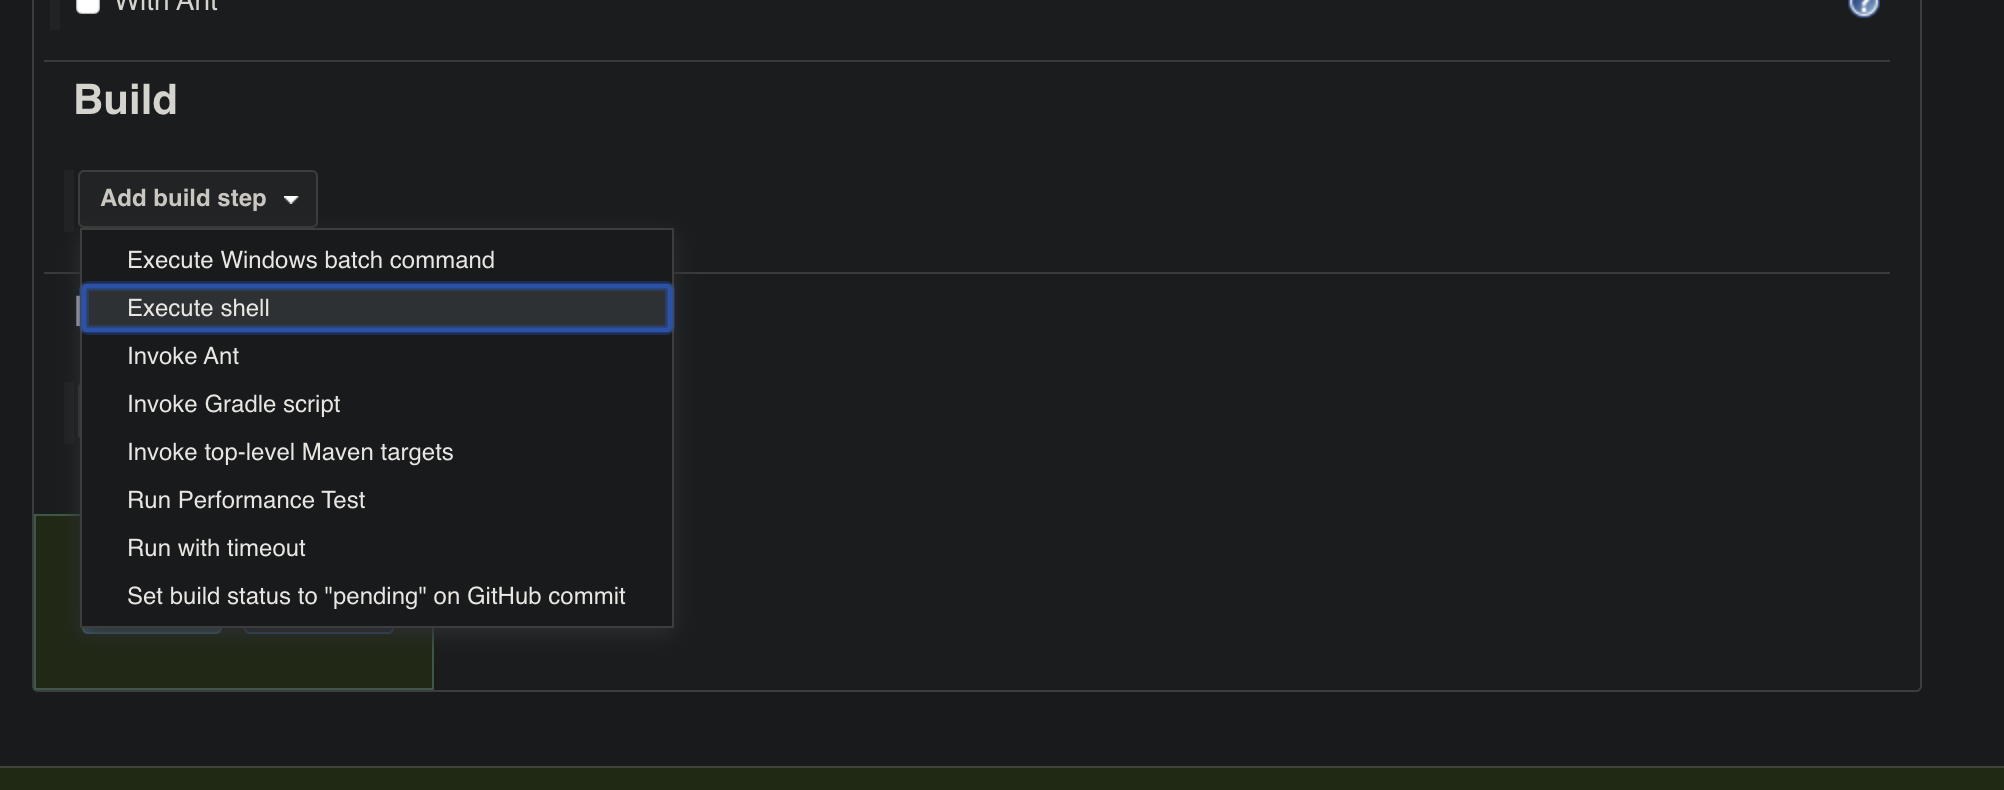
Clicking on Configure allows us to add the building steps.
Firstly we will add a Build step execute the exact command we use before to run JMeter in NON-GUI mode.
Secondly, we will add a Post-build step. The type will be Publishing Performance test result report, which is coupled to the Performance plugin.
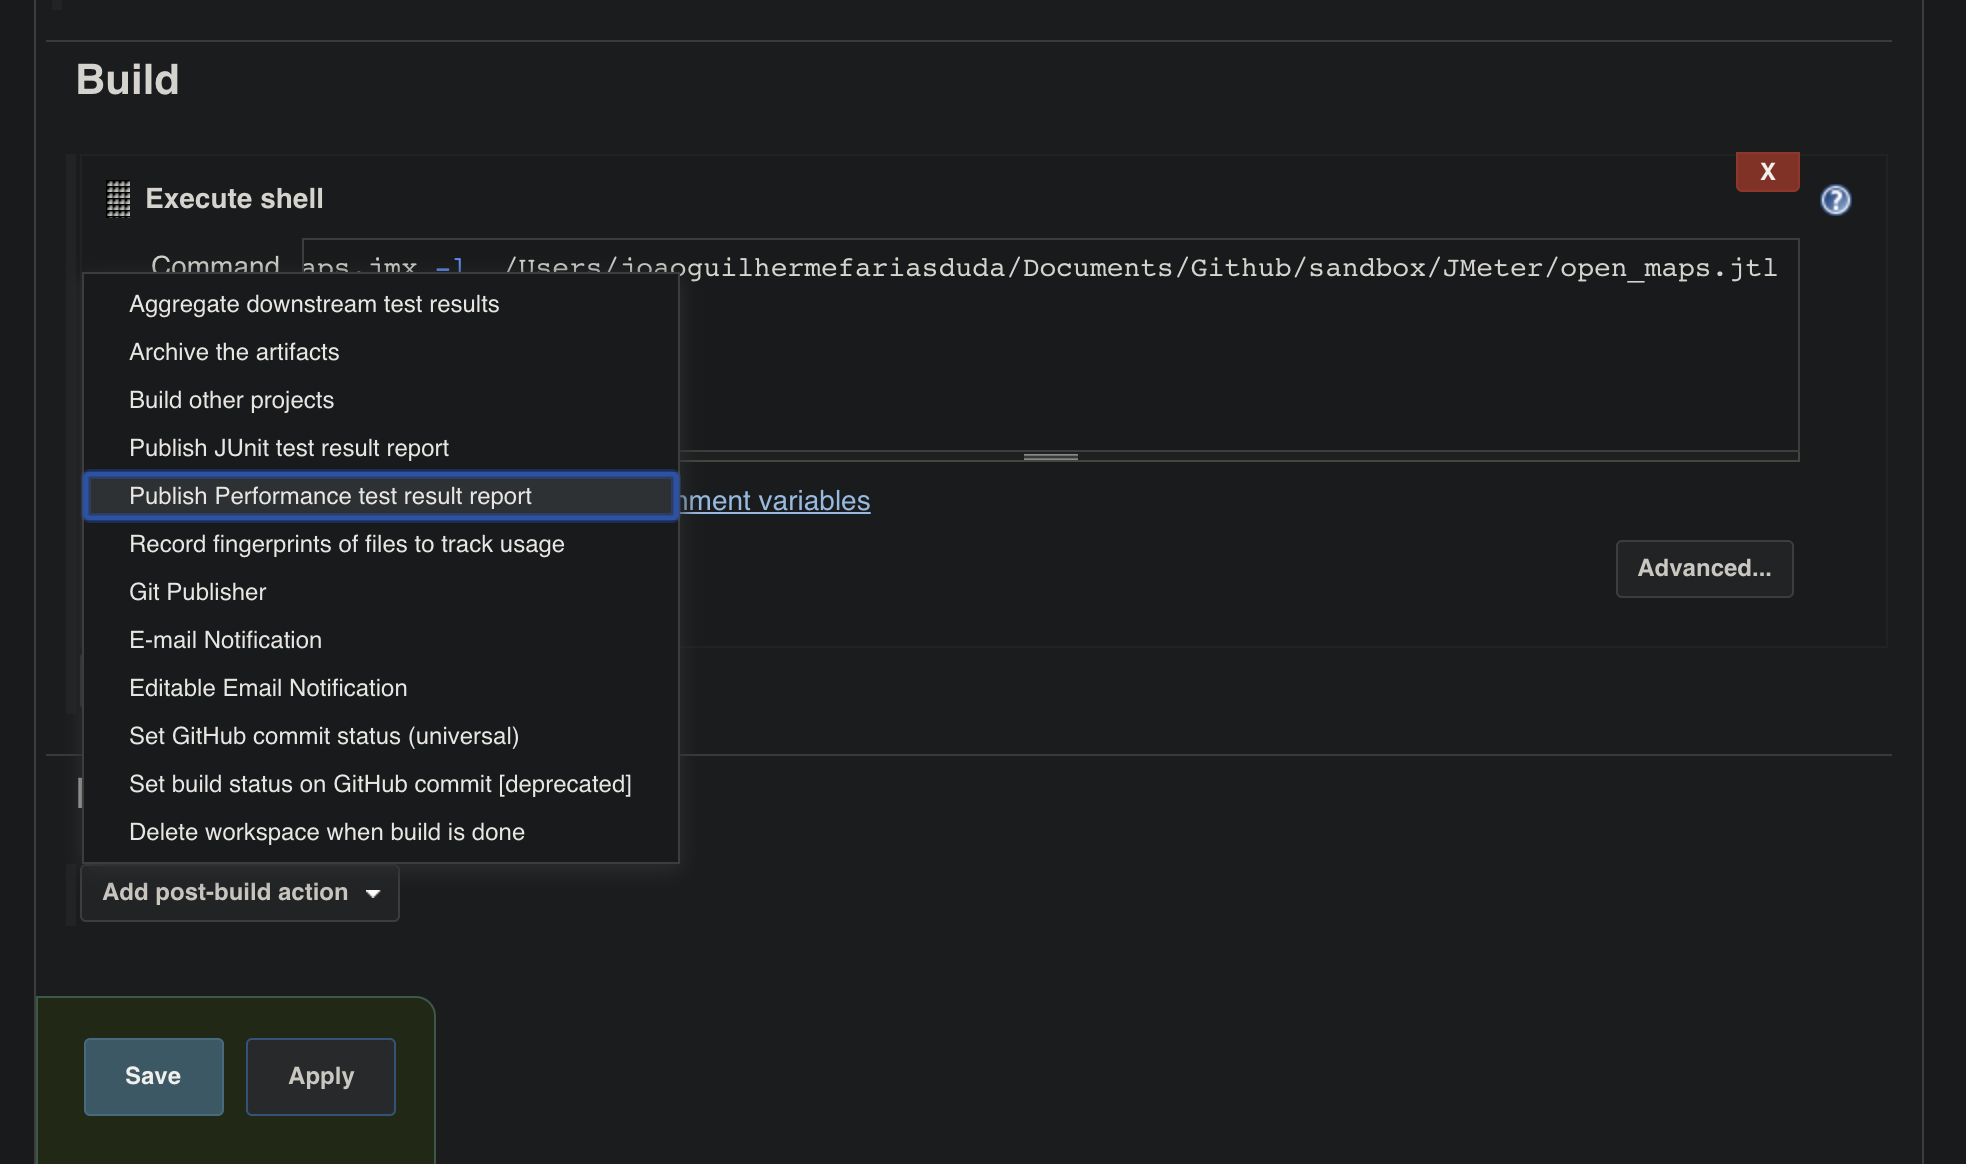
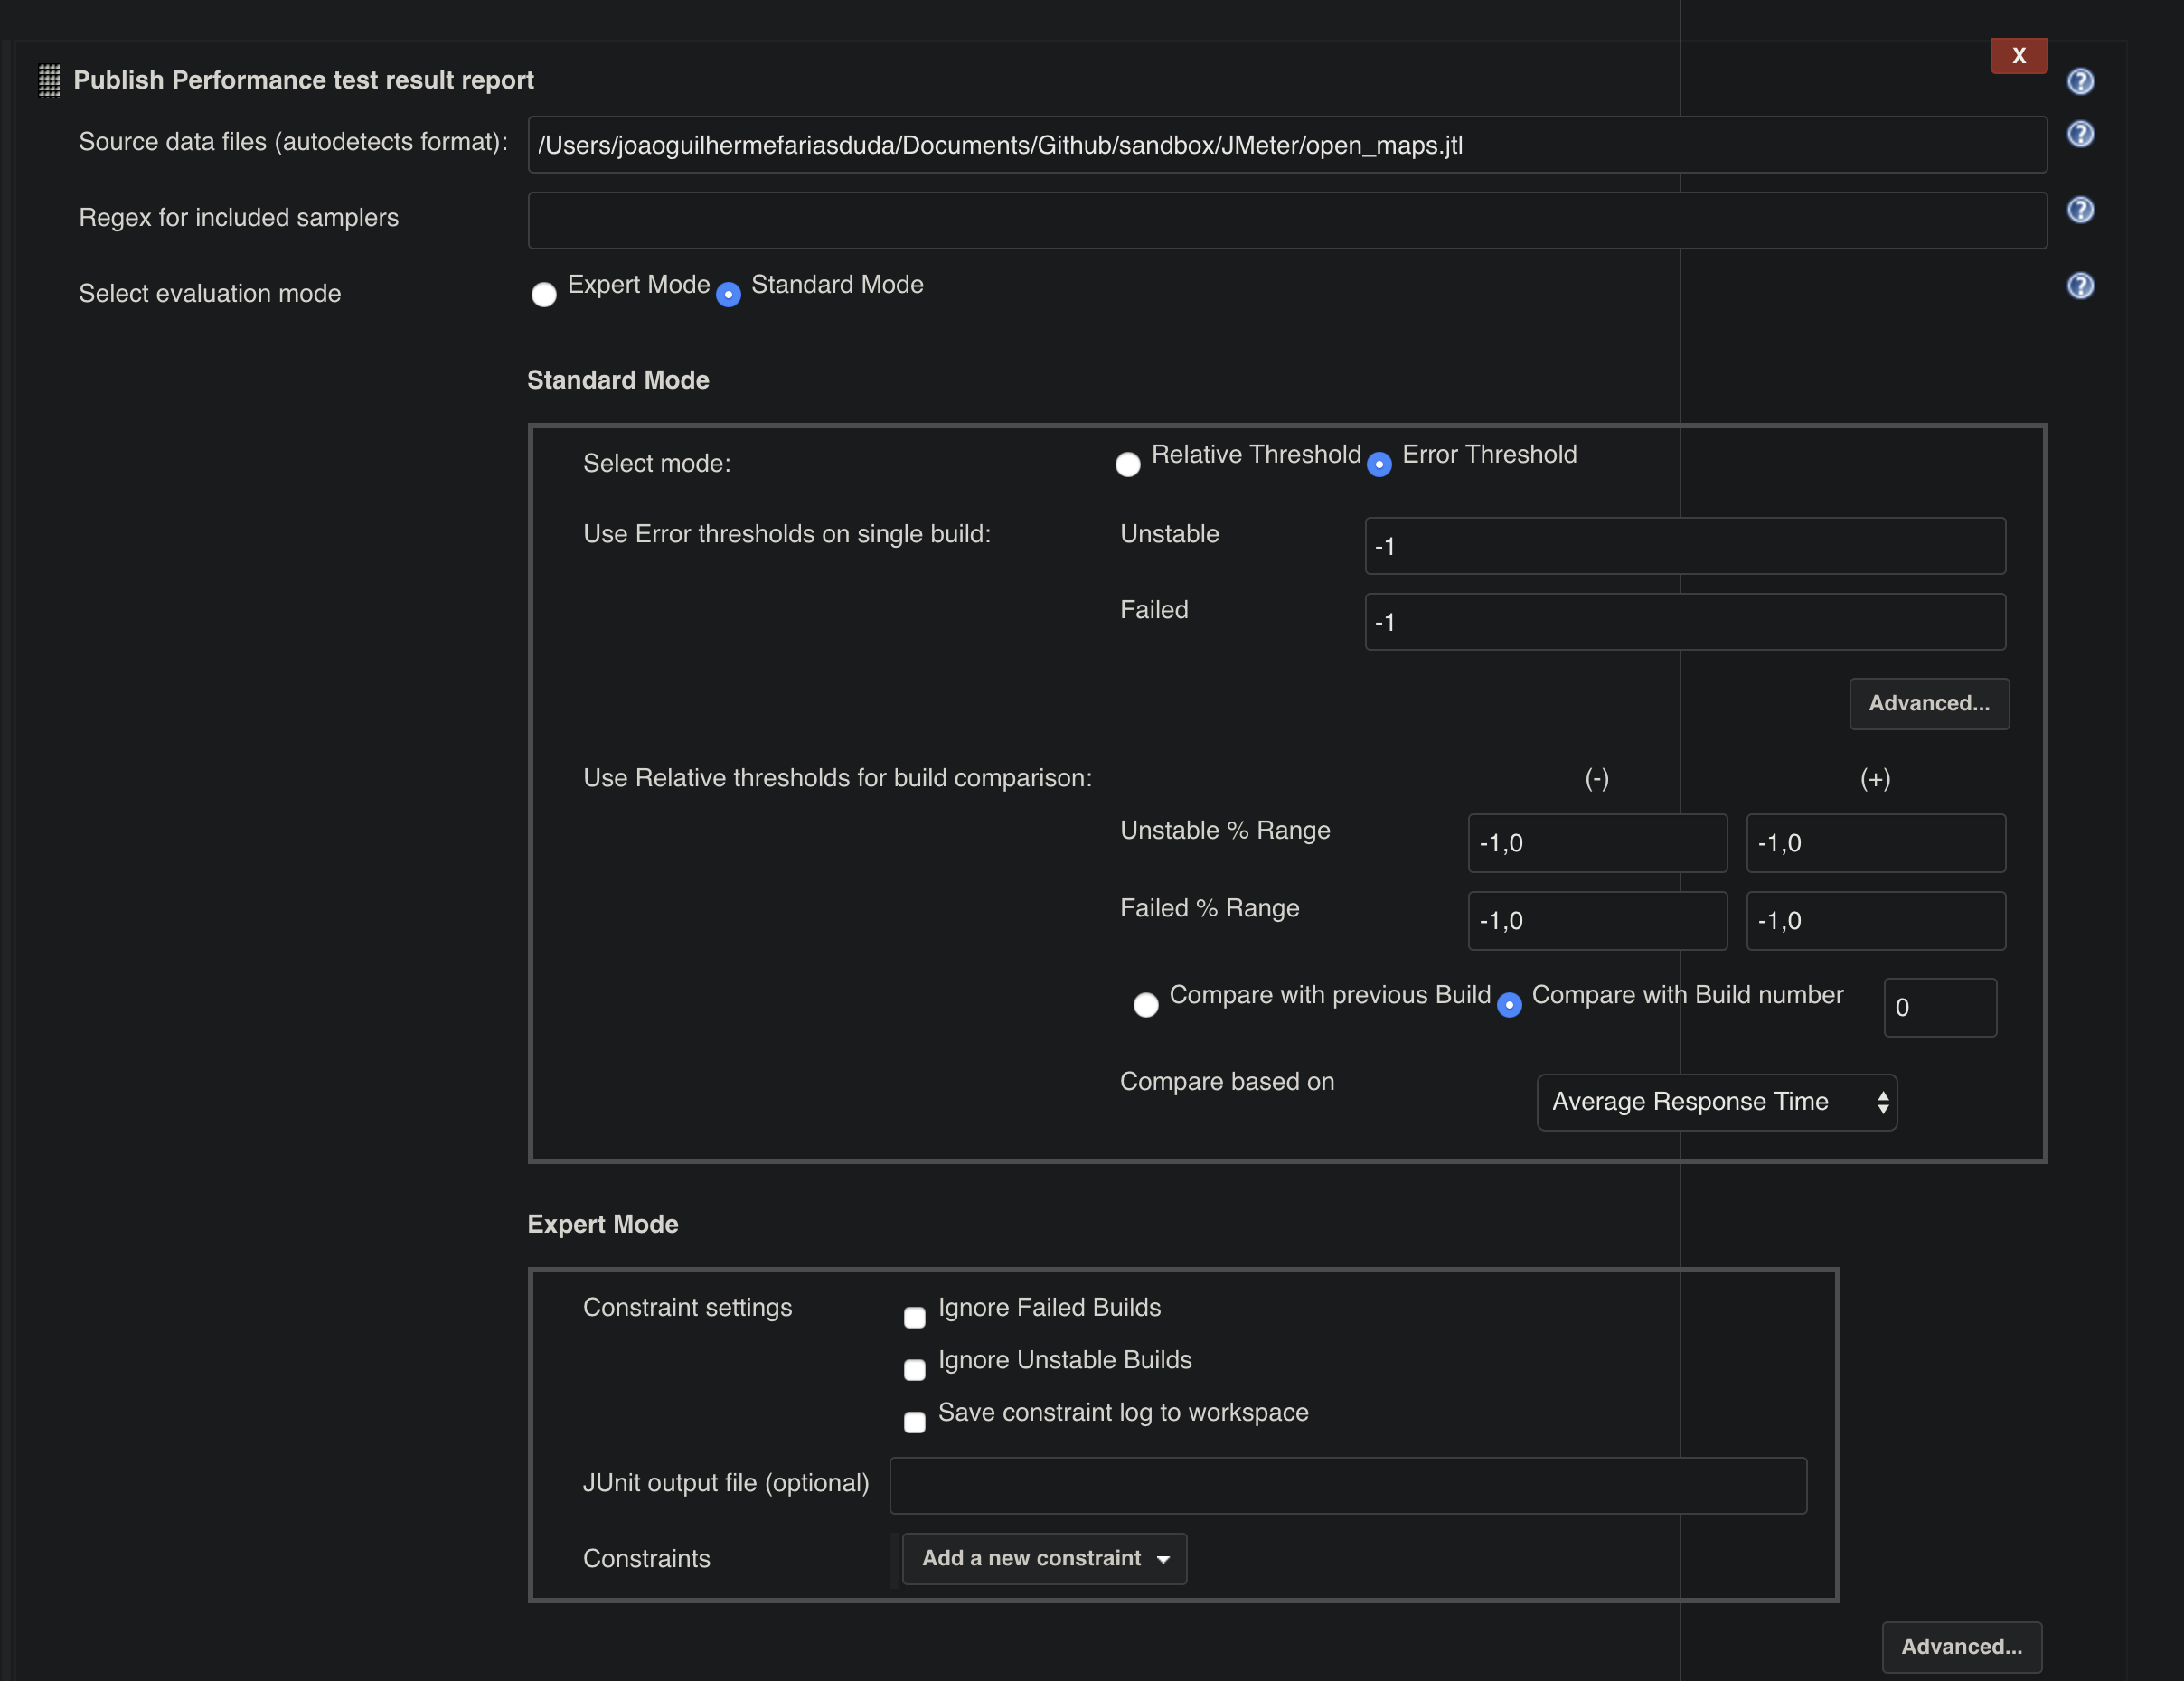
Here we just need to add the path to our .jtl file in the Source data files field.
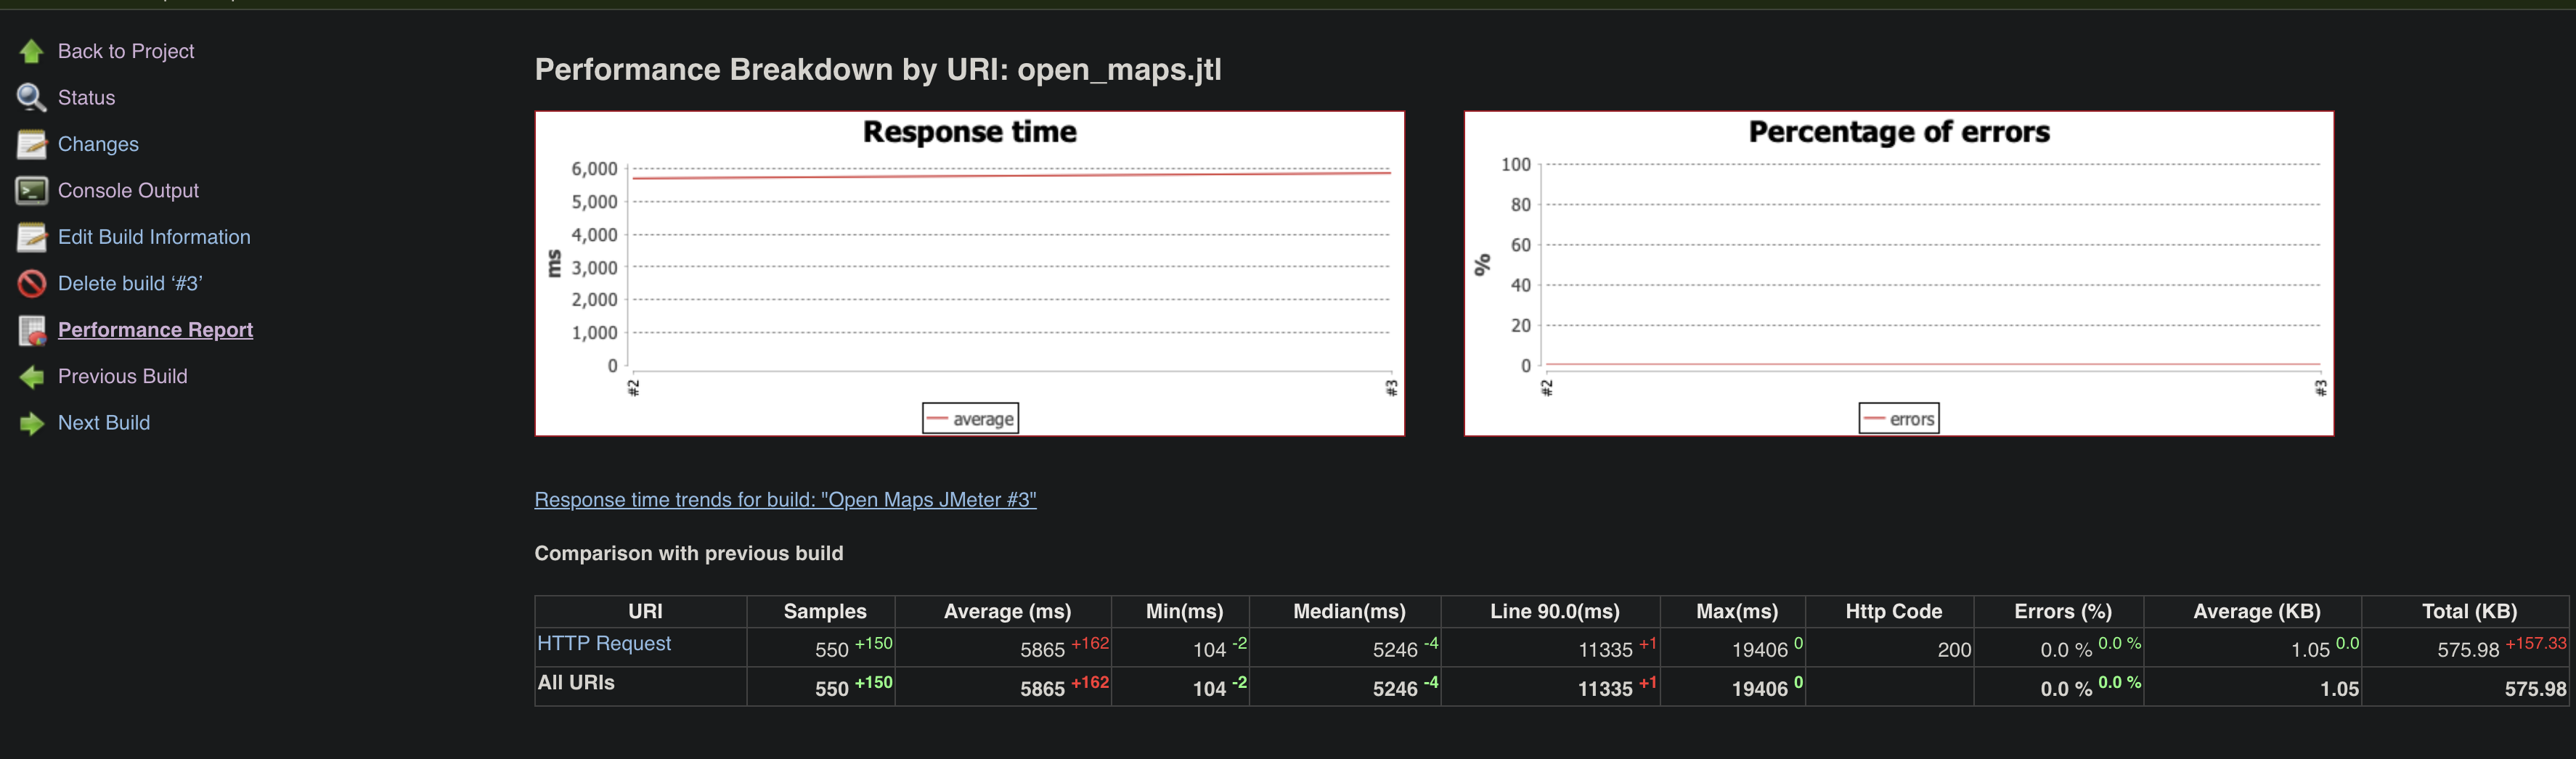
Information overview
After a couple of executions, you can see that the Performance plugin shows a trend chart on the job home page.
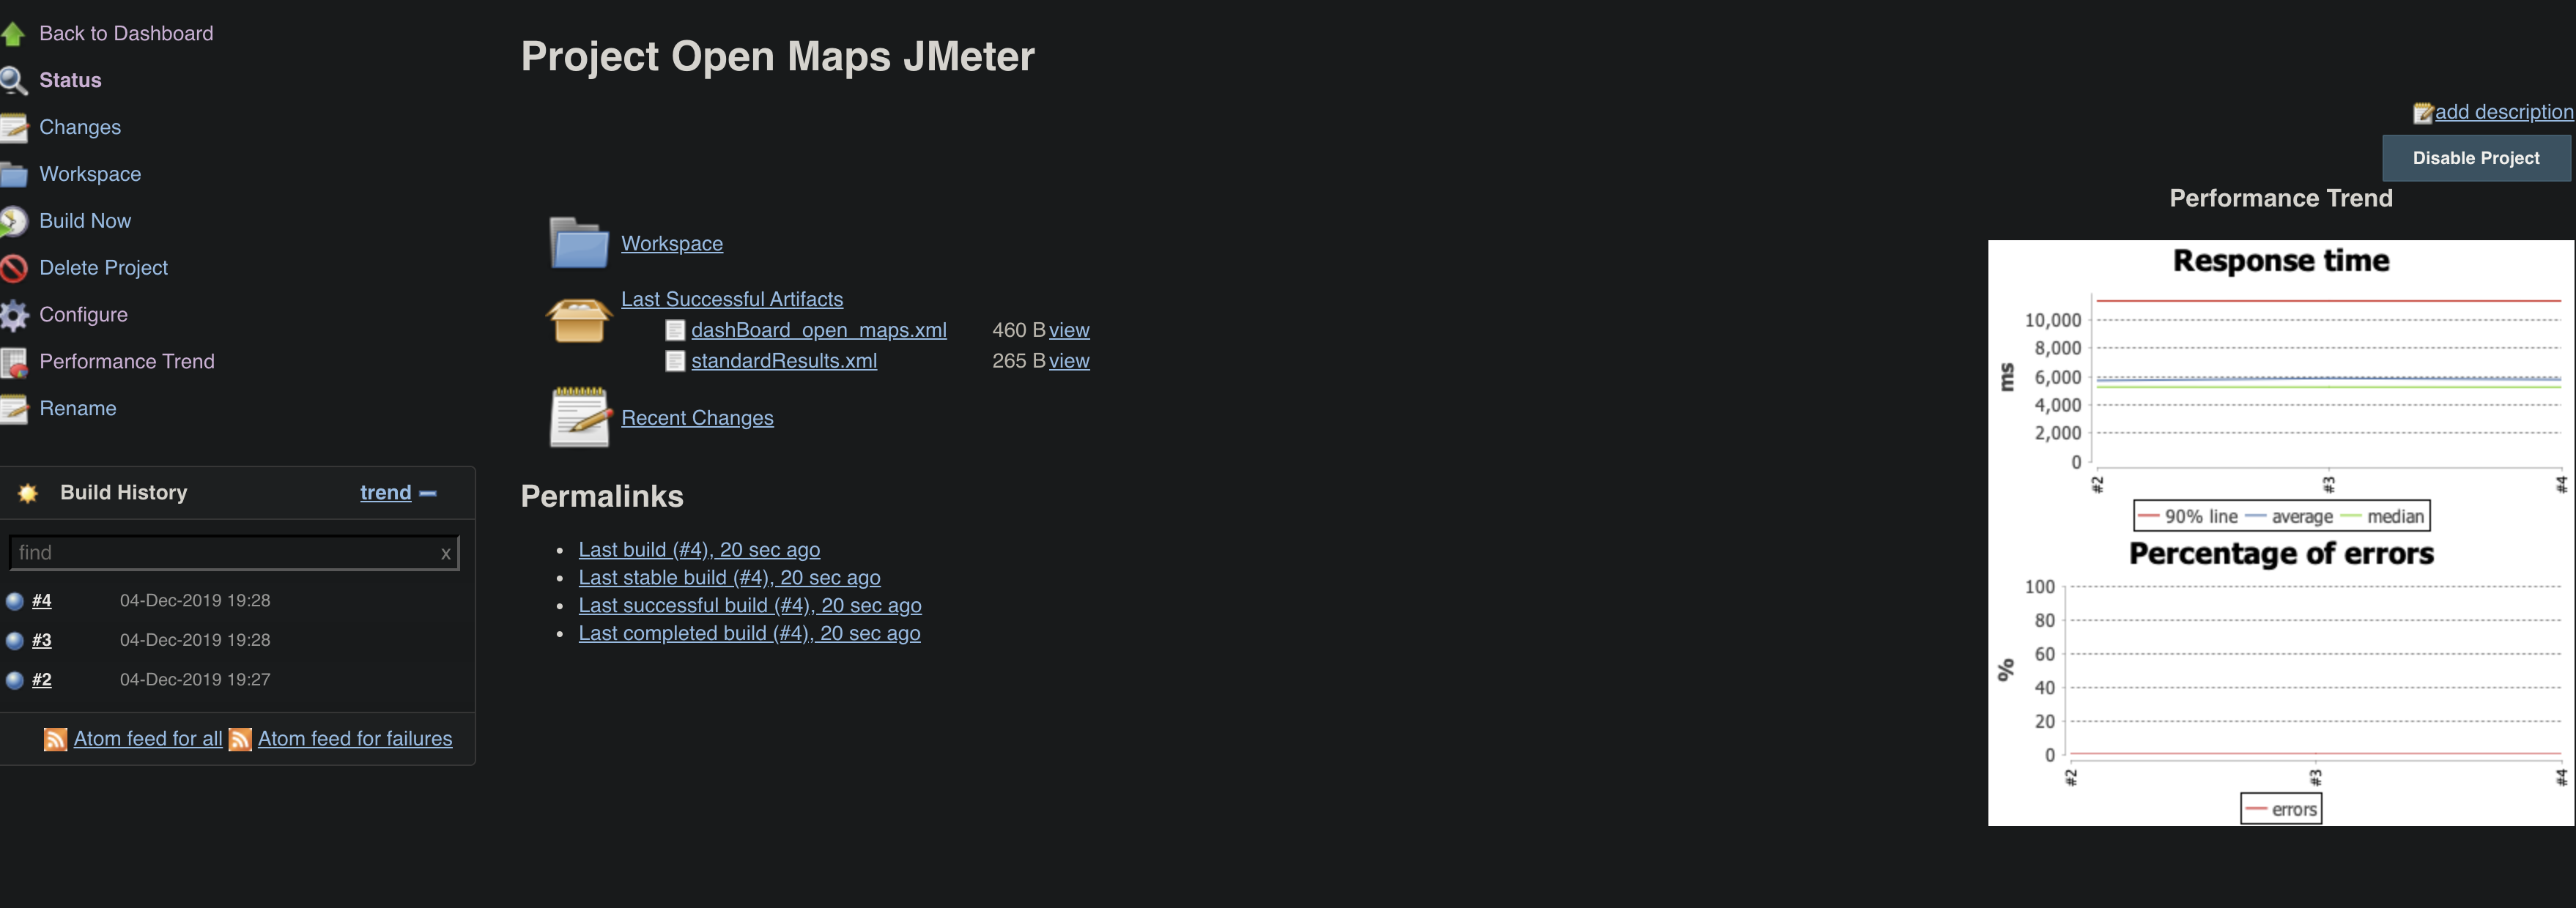
Additionally, you can see more detailed data into each execution.
Possible improvements
Of course, this is just the first step.
You can configure many triggers for the Jenkins job, such as a new commit on GitHub, a deployment on certain environment.
Also you can configure the JMeter plan itself, for instance, by passing arguments on the non-GUI command.
Conclusion
This ends the 5-part series to introduce JMeter, from the basics concepts to continous execution. You can check out the whole series here.
Comments
Comments are powered by Giscus and use GitHub Discussions. Sign in with GitHub to leave a comment.