Subscribe to our RSS here.
Introduction JMeter Series
What is JMeter?

JMeter is a load testing tool designed and maintained by Apache released in 1998. It is written in Java, which makes it easy to run out-of-the-box in any system with a JVM.
Fetching Bitcoin Orders from Mercado Bitcoin API
What We Will Do
Mercado Bitcoin is one of the biggest cryptocurrencies exchanges from Brazil, providing its services for Bitcoin, Litecoin, Ethereum and others coins.
The platform provides an API to fetch data from its usage. The best thing is that this API is simple, doesn’t require any account or authentication: Perfect to start with JMeter, since we can focus indeed on the basics.
For this post we will investigate the performance of the orderbook endpoint. The orderbook is the registration of all negotiation requests (selling and buying). We will simply hit the endpoint for the Bitcoin’s orderbook many times and register how long does it take to complete our requests.
Creating Our Test Plan
The root for any JMeter project is the Test Plan.
A Test Plan will group a series of steps that JMeter will execute.
Additionally, it can provide general configuration that will be shared everywhere, such as User Defined Variables.
But this is theme for another post…
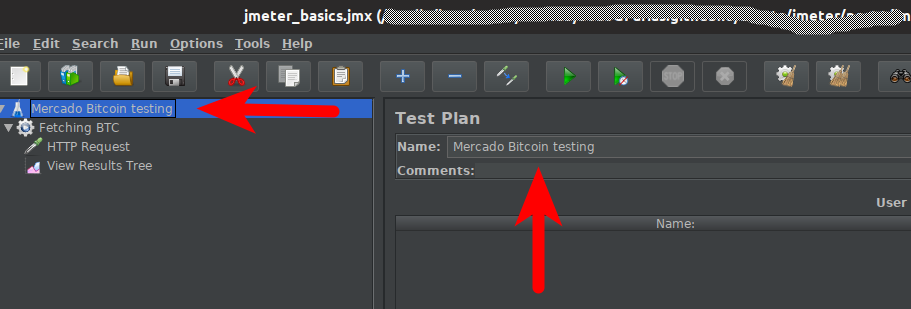
For our purposes the Test Plan will serve only to name our project.
Here we simply change the Test Plan name and JMeter updates it on the tree structure.
Thread Groups: Execution Configuration
Thread Groups elements serve to setup an execution scenario - they are the “how” we will run.
In Thread Groups, we can define the requests we want to send - and also the frequency.

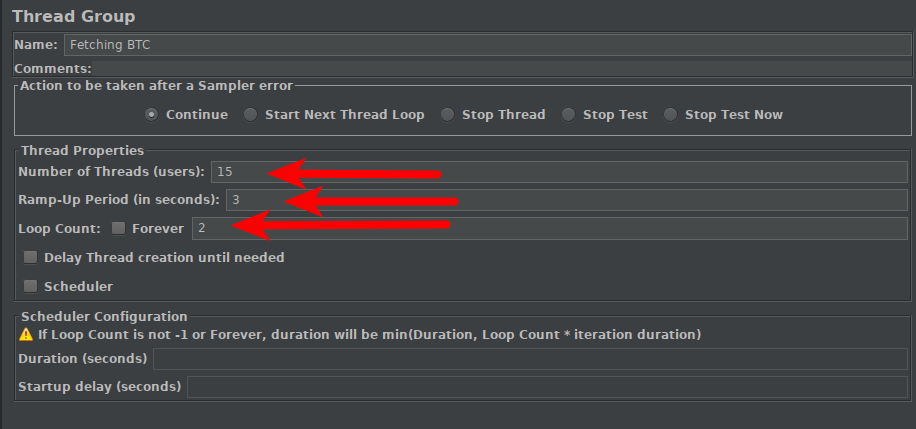
A Thread Group have three main configuration parameters:
-
Number of Threads (users): It configures how many users will be simulated. Each user will execute each request under the Thread Group. E.g. if you configure requests for two endpoints and 30 threads, you will have 60 requests in total.
-
Ramp-up Period (in seconds): The ramp-up time is the time that JMeter will take to start all configured threads. E.g. if we set 50 threads and a ramp-up of 250 seconds, each thread will start 5 seconds after the previous one:
- Thread 1 - time 0
- Thread 2 - time 5
- …
- Thread 50 - time 250
-
Loop Count: The number of times the Thread Group will be executed as a whole - it is basically a… loop. In the example above, if you setup a Loop Count of 3, JMeter will take 250 seconds to start the first 60 requests; then, when all of them finish, JMeter will take more 250 seconds to start 60 more requests; and then it again. The total number of requests will be 180 - however, the total time will not be 250*3=750 seconds; it will be 750 + total time that take for the last request finish (if you application has bad performance…).
Samplers: Our Tests
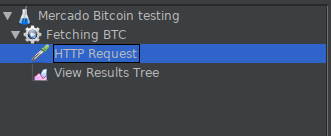
Sampler is the “what” we will test. It defines the request itself.
In our example, we will use only HTTP requests.
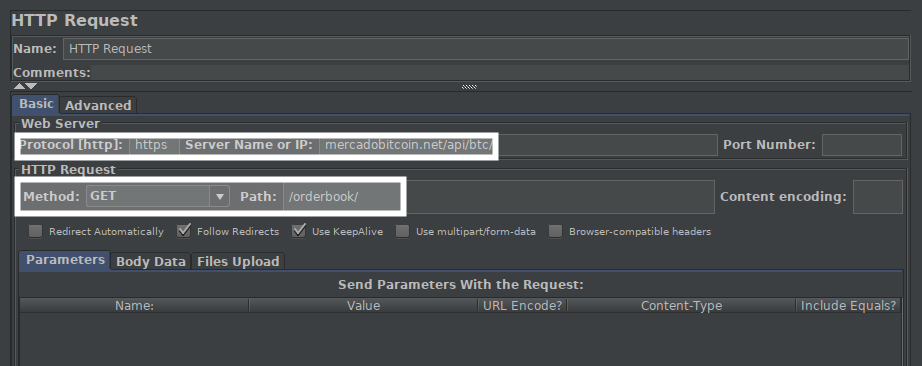
It has two main parameters:
-
Web Server: It defines the URL of the server that will be hit;
-
HTTP Request: It defines the HTTP Method (GET, POST, PATCH…) and the HTTP resource path
Listeners: Reporting Results
Finally, in order to understand the behavior of our application, we must read how requests behaved.
That’s were Listeners enter.
The goal of a listener is to display the results of all requests from a Thread Group in a specific way.
In our example, we will use the View Results Tree and the Summary Report listeners.
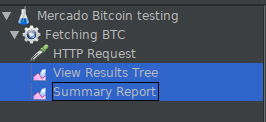
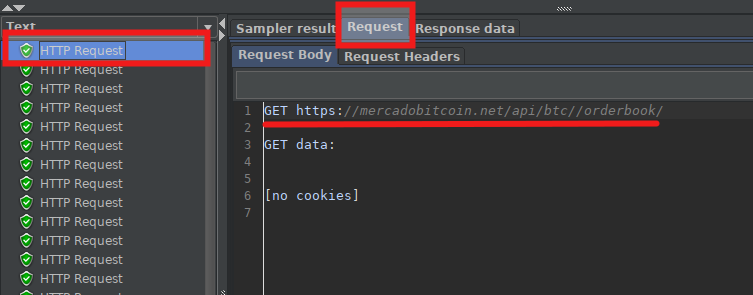
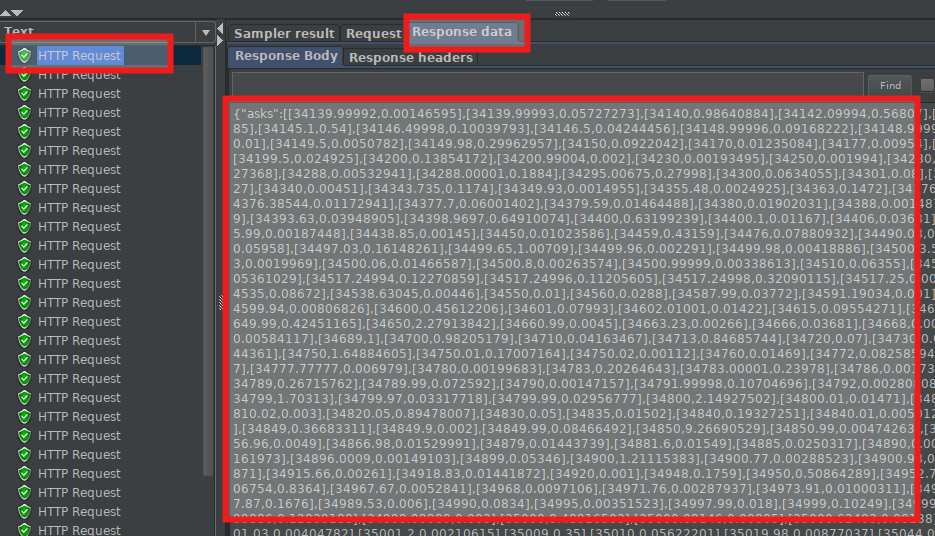
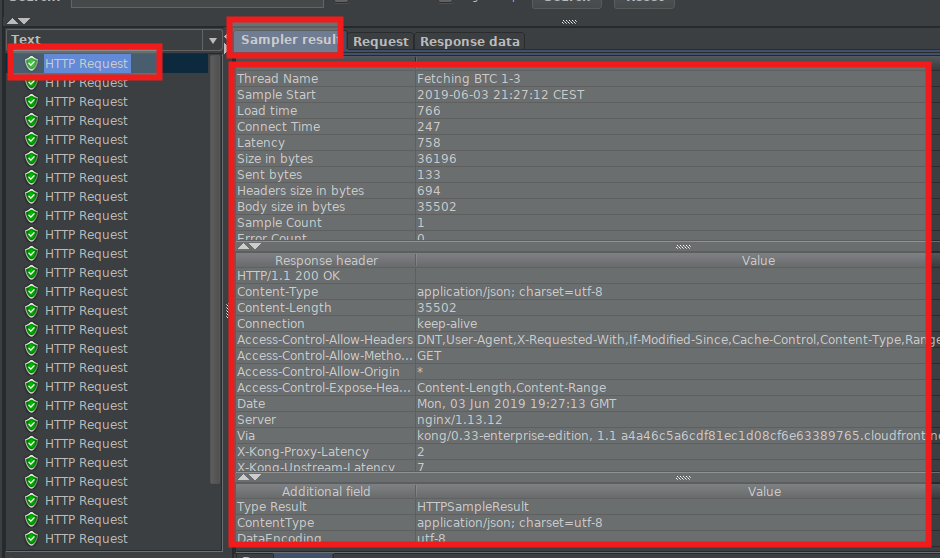
The View Results Tree will display data of each request separately, showing the details of the request, the details of the response and a summary of the call.
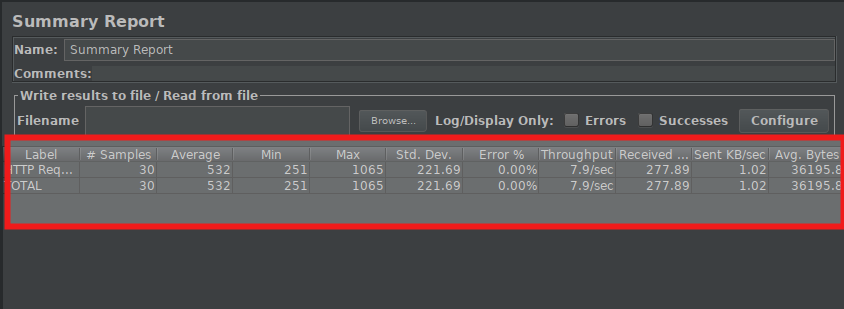
The Summary Report shows statistical data from the set of requests, regarding response time and size.
You can download the JMeter suite here
What to do from here?
JMeter has a manifold of features - different types of servers, different listeners.
In this tutorial series, we will focus more on how to create usable and extensive JMeter suites, in order to make them a tool to enable agility.
Our series will follow talking about:

Leave a comment